A Bode plot is a graph that maps the frequency response of the system. It was first introduced by Hendrik Wade Bode in 1940.
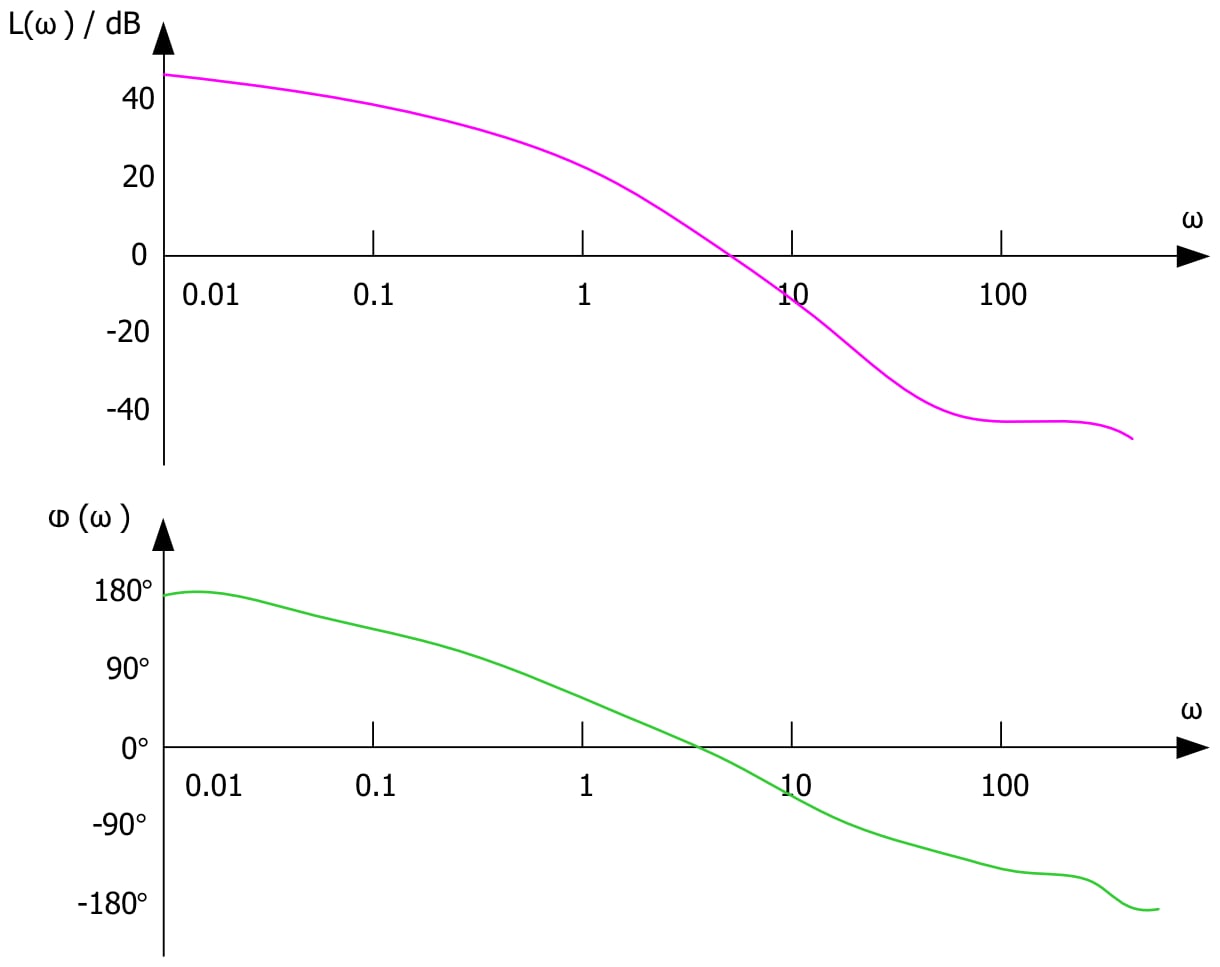
The Bode plot consists of the Bode magnitude plot and the Bode phase plot. Both the amplitude and phase graphs are plotted against the frequency. The horizontal axis is lgω (logarithmic scale to the base of 10), and the logarithmic scale is used. The vertical axis of the Bode magnitude plot is 20lg (dB), and the linear scale is used, with the unit in decibel (dB). The vertical axis of the Bode phase plot uses the linear scale, with the unit in degree (°). Usually, the Bode magnitude plot and the Bode phase plot are placed up and down, with the Bode magnitude plot at the top, with their respective vertical axis being aligned. This is convenient to observe the magnitude and phase value at the same frequency, as shown in the following figure.
The loop analysis test method is as follows: Inject a sine-wave signal with constantly changing frequencies into a switching power supply circuit as the interference signal, and then judge the ability of the circuit system in adjusting the interference signal at various frequencies according to its output.
This method is commonly used in the test for the switching power supply circuit. The measurement results of the changes in the gain and phase of the output voltage can be output to form a curve, which shows the changes of the injection signal along with the frequency variation. The Bode plot enables you to analyze the gain margin and phase margin of the switching power supply circuit to determine its stability.


Leave a Comment