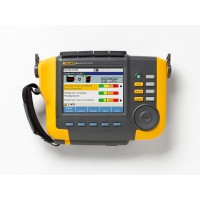
Fluke 810 is a vibration analyzer with diagnostic technology that represents an advanced tool for mechanical maintenance teams. This analyzer allows for rapid identification and prioritization of mechanical problems, integrating the expertise of a vibration analysis expert into a portable device.
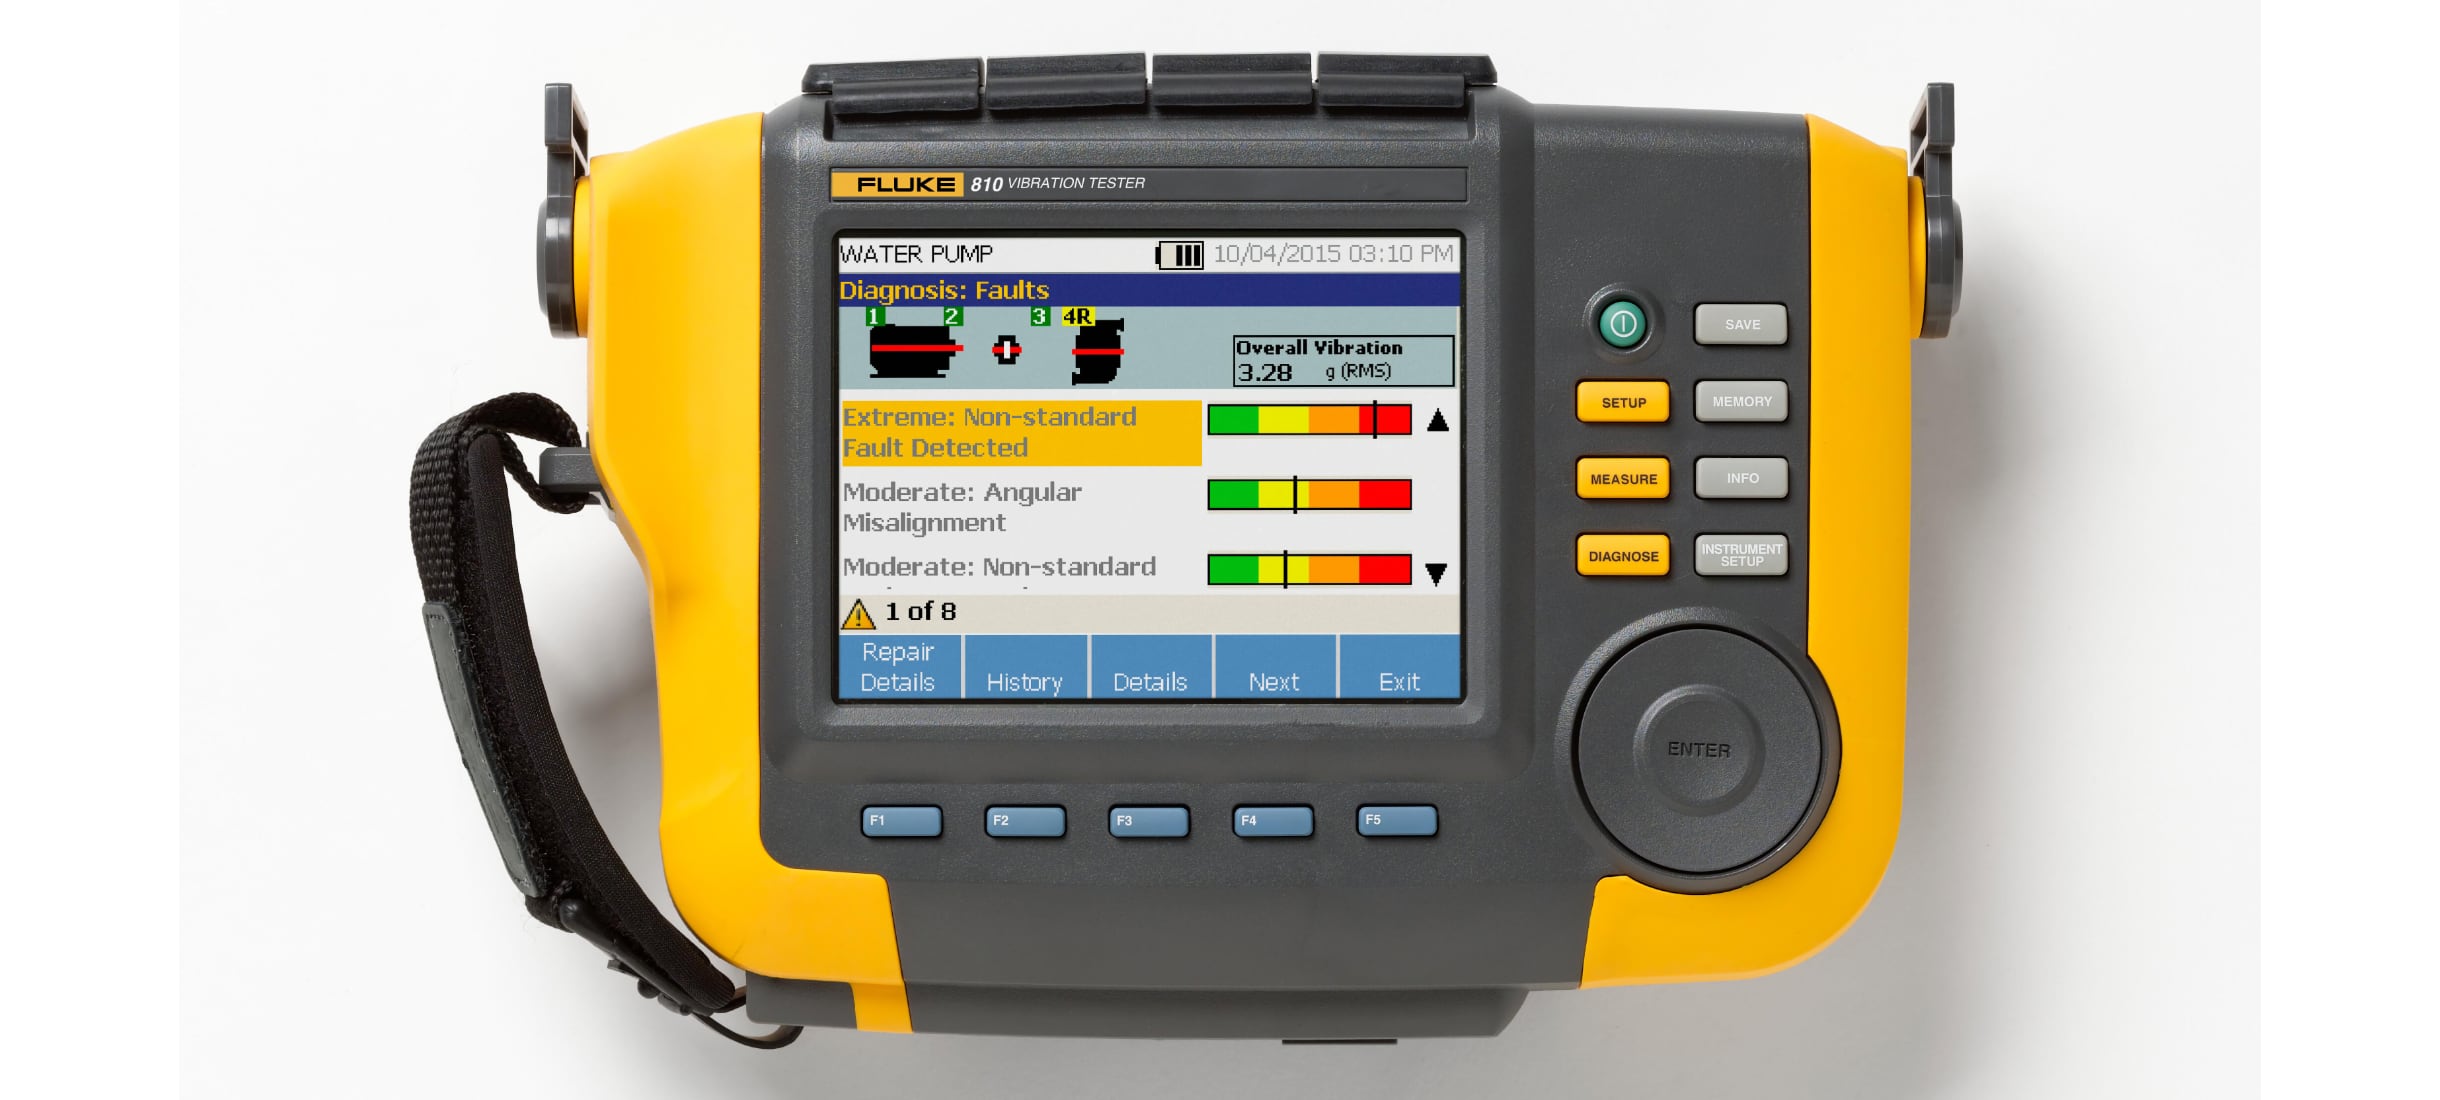
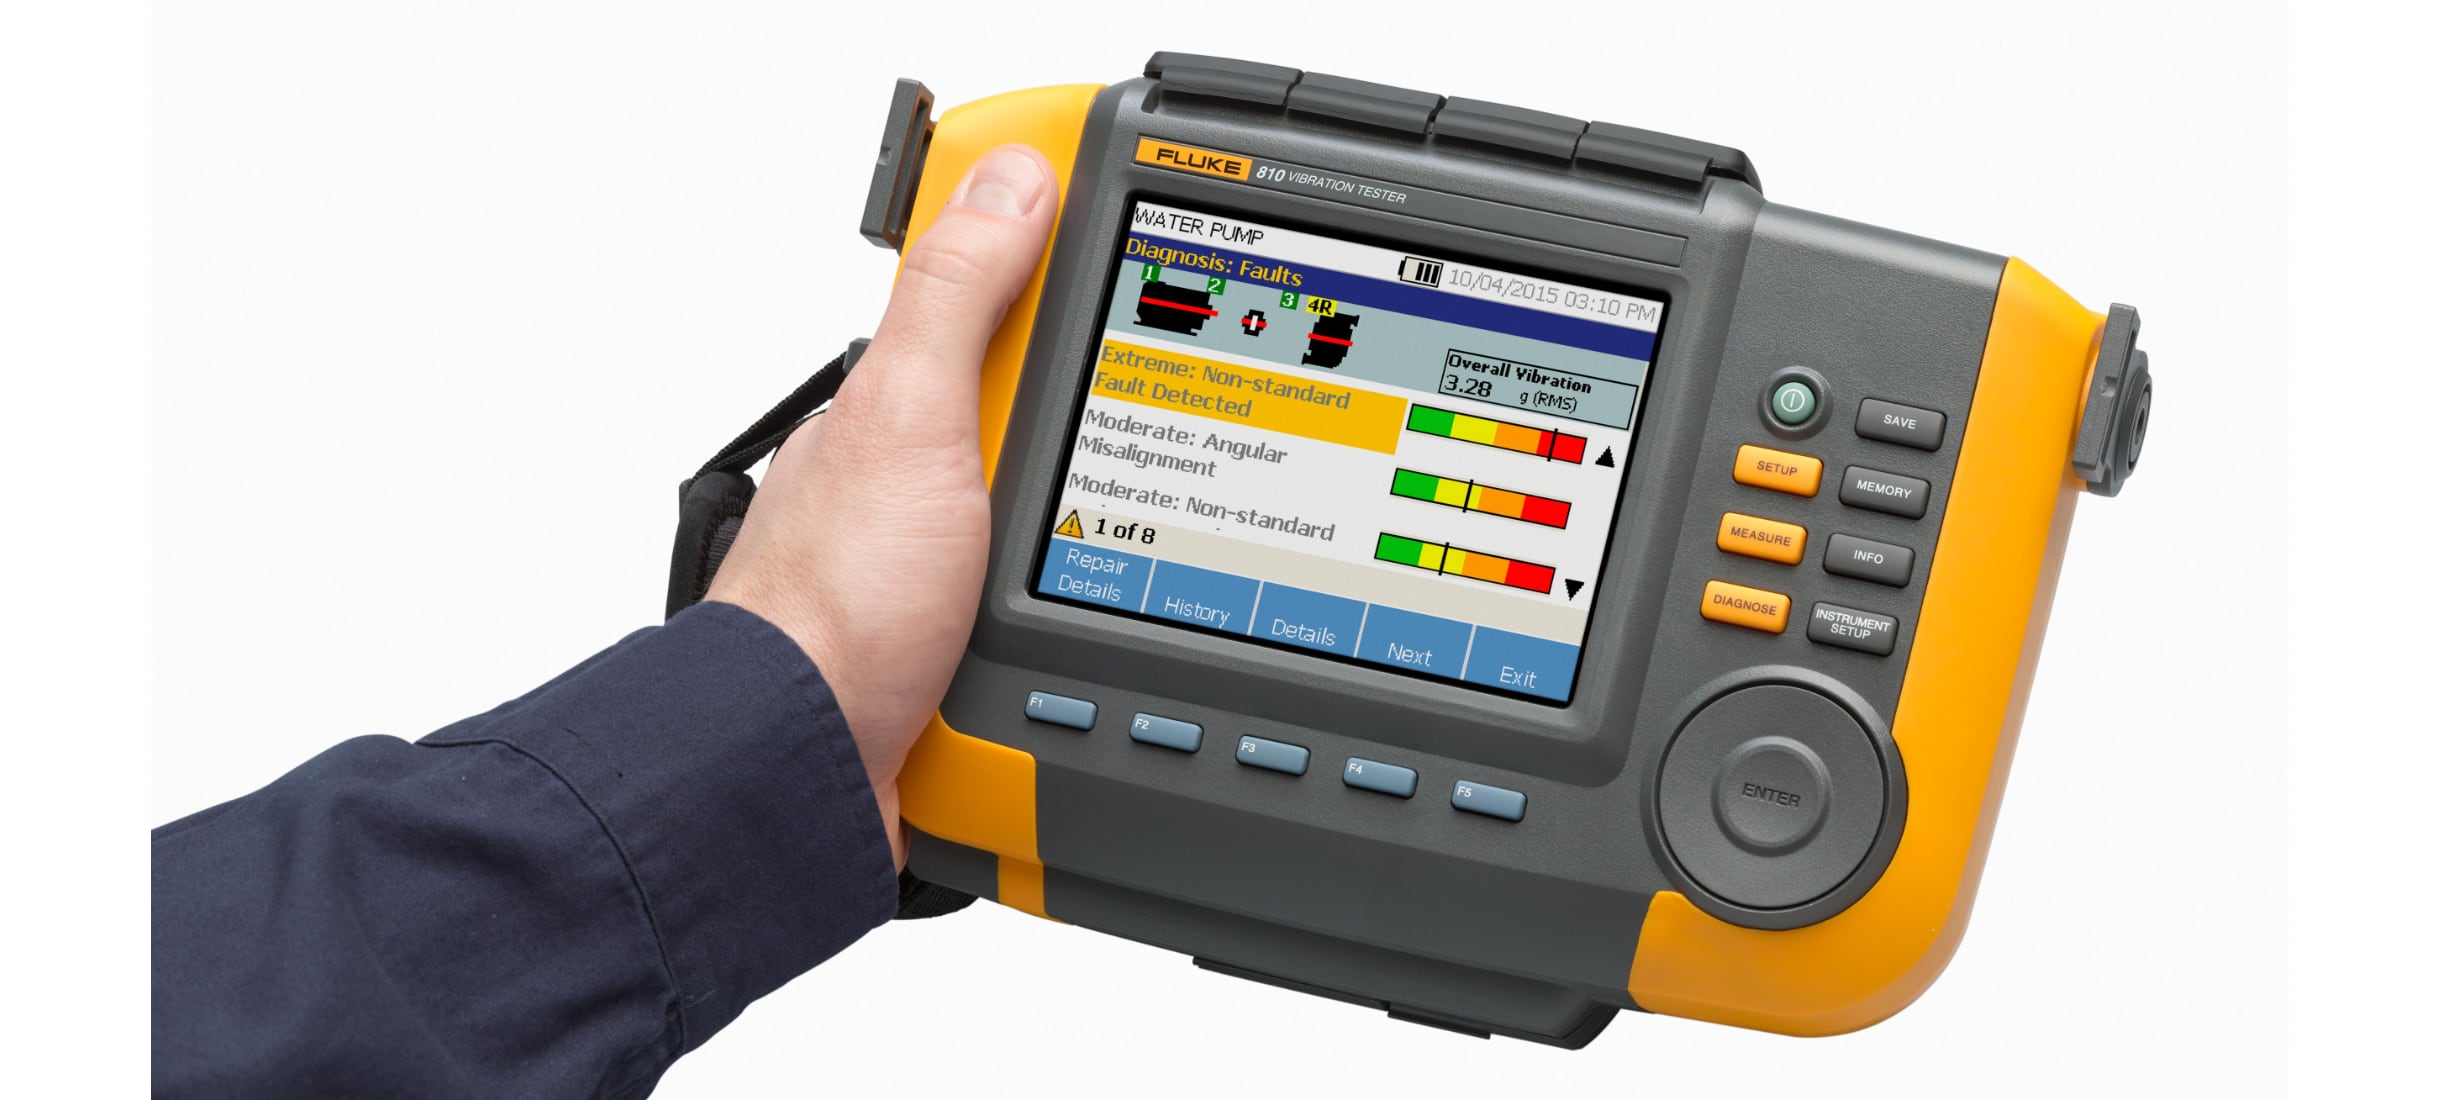
Fluke 810 utilizes diagnostic technology that analyzes the machine, providing a textual report of mechanical faults, their respective severity levels, and repair recommendations from the very first measurements, without the need to consult previous history. Faults are identified by comparing vibration data against a database of rules developed over years of operational experience.
Key Features and Diagnostics
Fluke 810 is primarily designed for equipment troubleshooting and is highly useful for examining asset conditions before or after scheduled maintenance interventions. Its salient features include:
- Onboard Diagnostics: Automatic identification and location of the four most common standard mechanical faults: bearings, looseness, misalignment, and unbalance.
- Four-Level Severity Scale: Immediate assessment of the problem's scale by classifying fault severity into four levels: Slight, Moderate, Serious, or Extreme, supporting technicians in prioritizing interventions.
- Actionable Recommendations: Specific repair tips presented in order of priority to address anomalies systematically.
- Overall Vibration Measurement: Rapid assessment of the overall machine health available directly from the diagnosis screen.
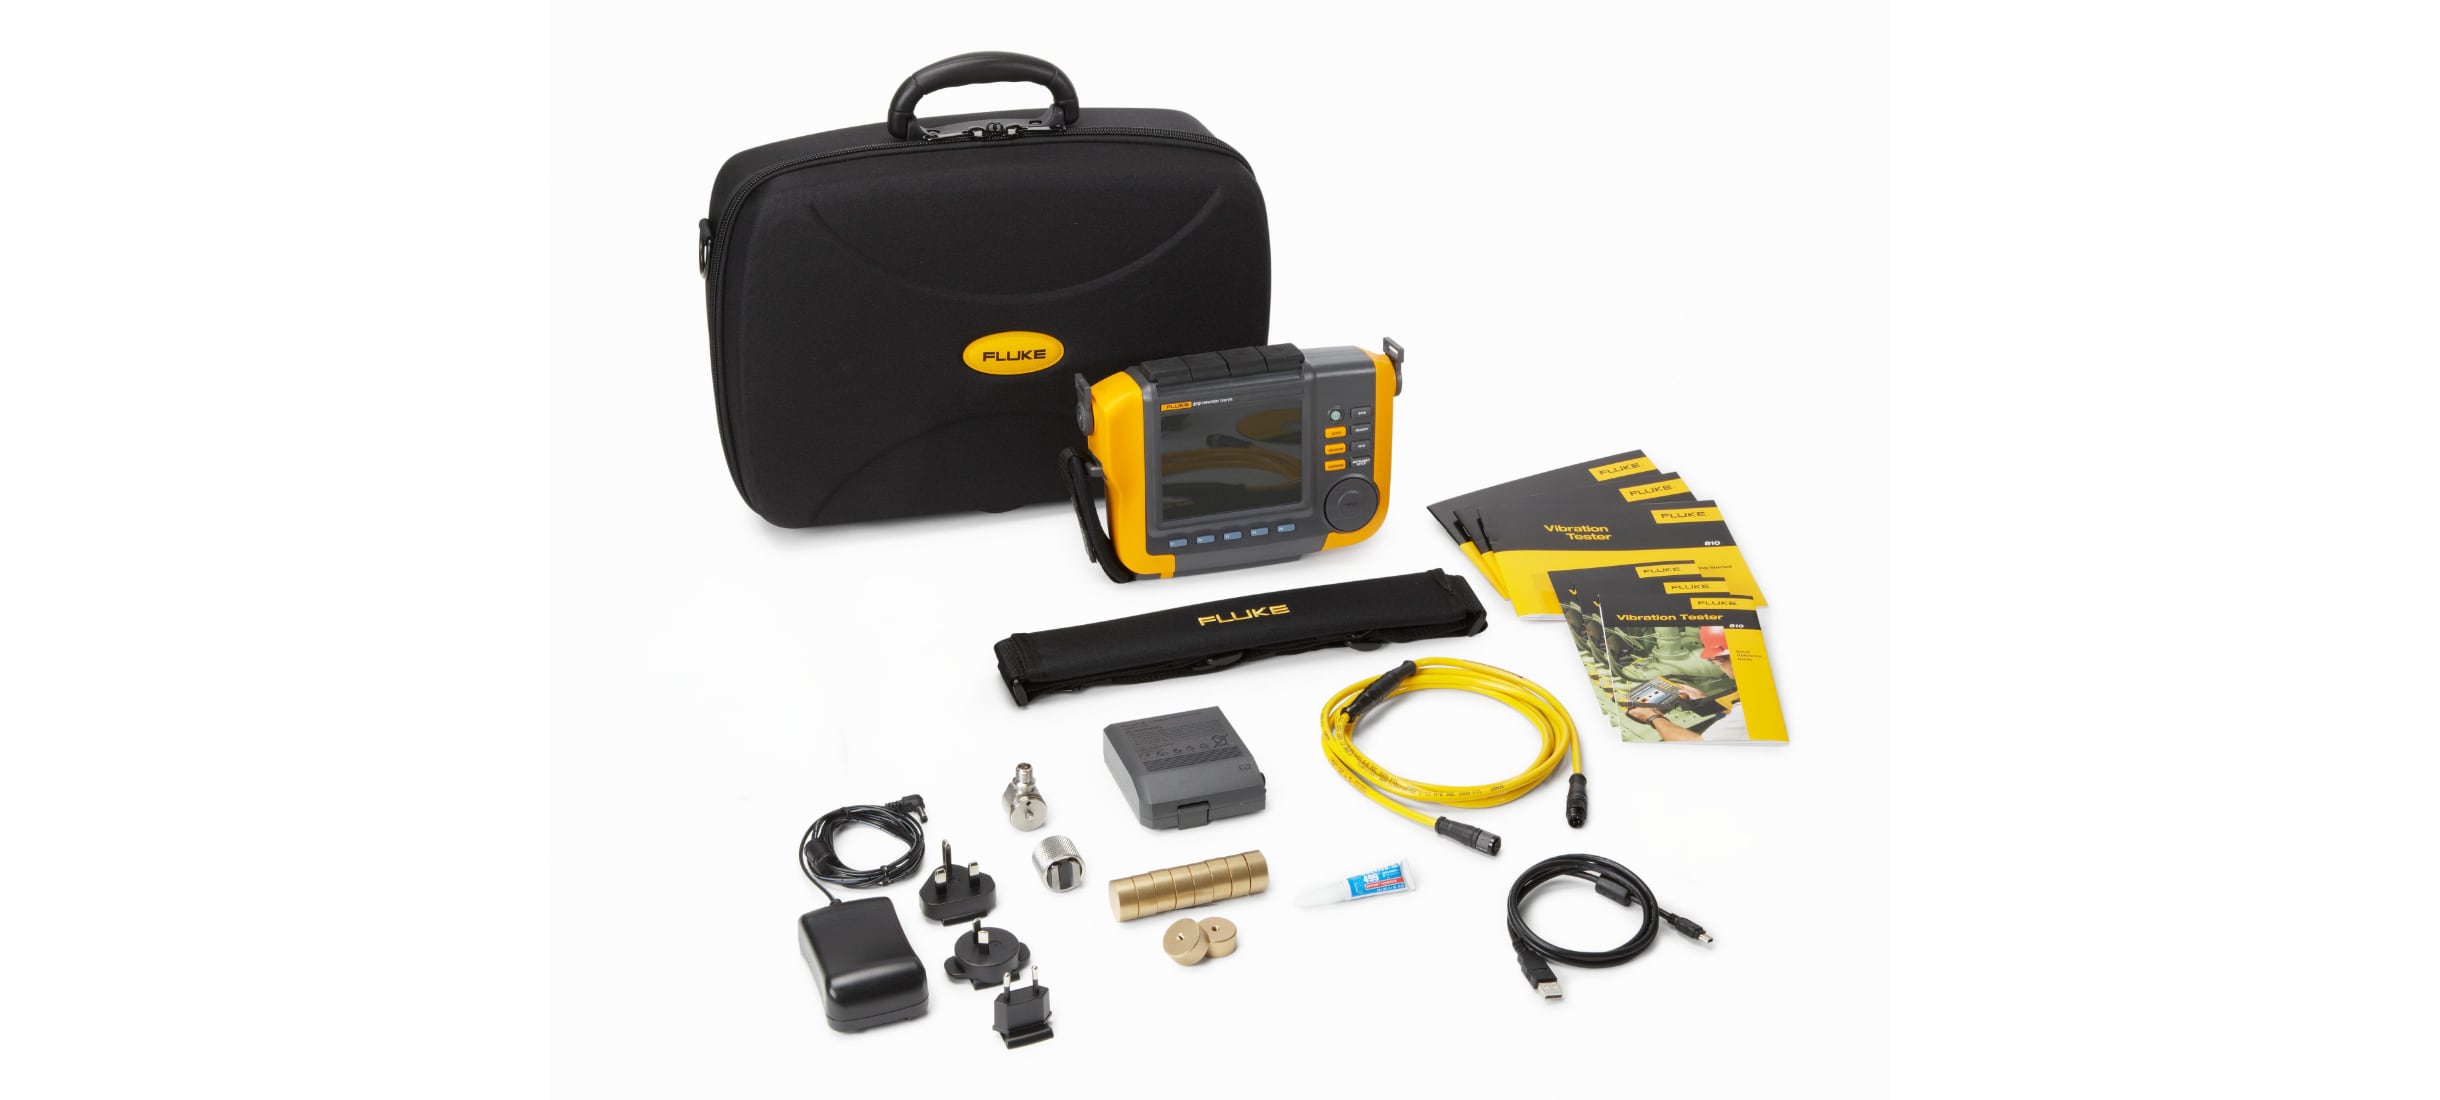
- Advanced Sensor: The included TEDS triaxial accelerometer reduces measurement time by two-thirds compared to single-axis accelerometers.
- Flexible Configuration: Ability to test a wide range of components such as drive belts, gearboxes, and bevel gears thanks to advanced machine speed configuration options.
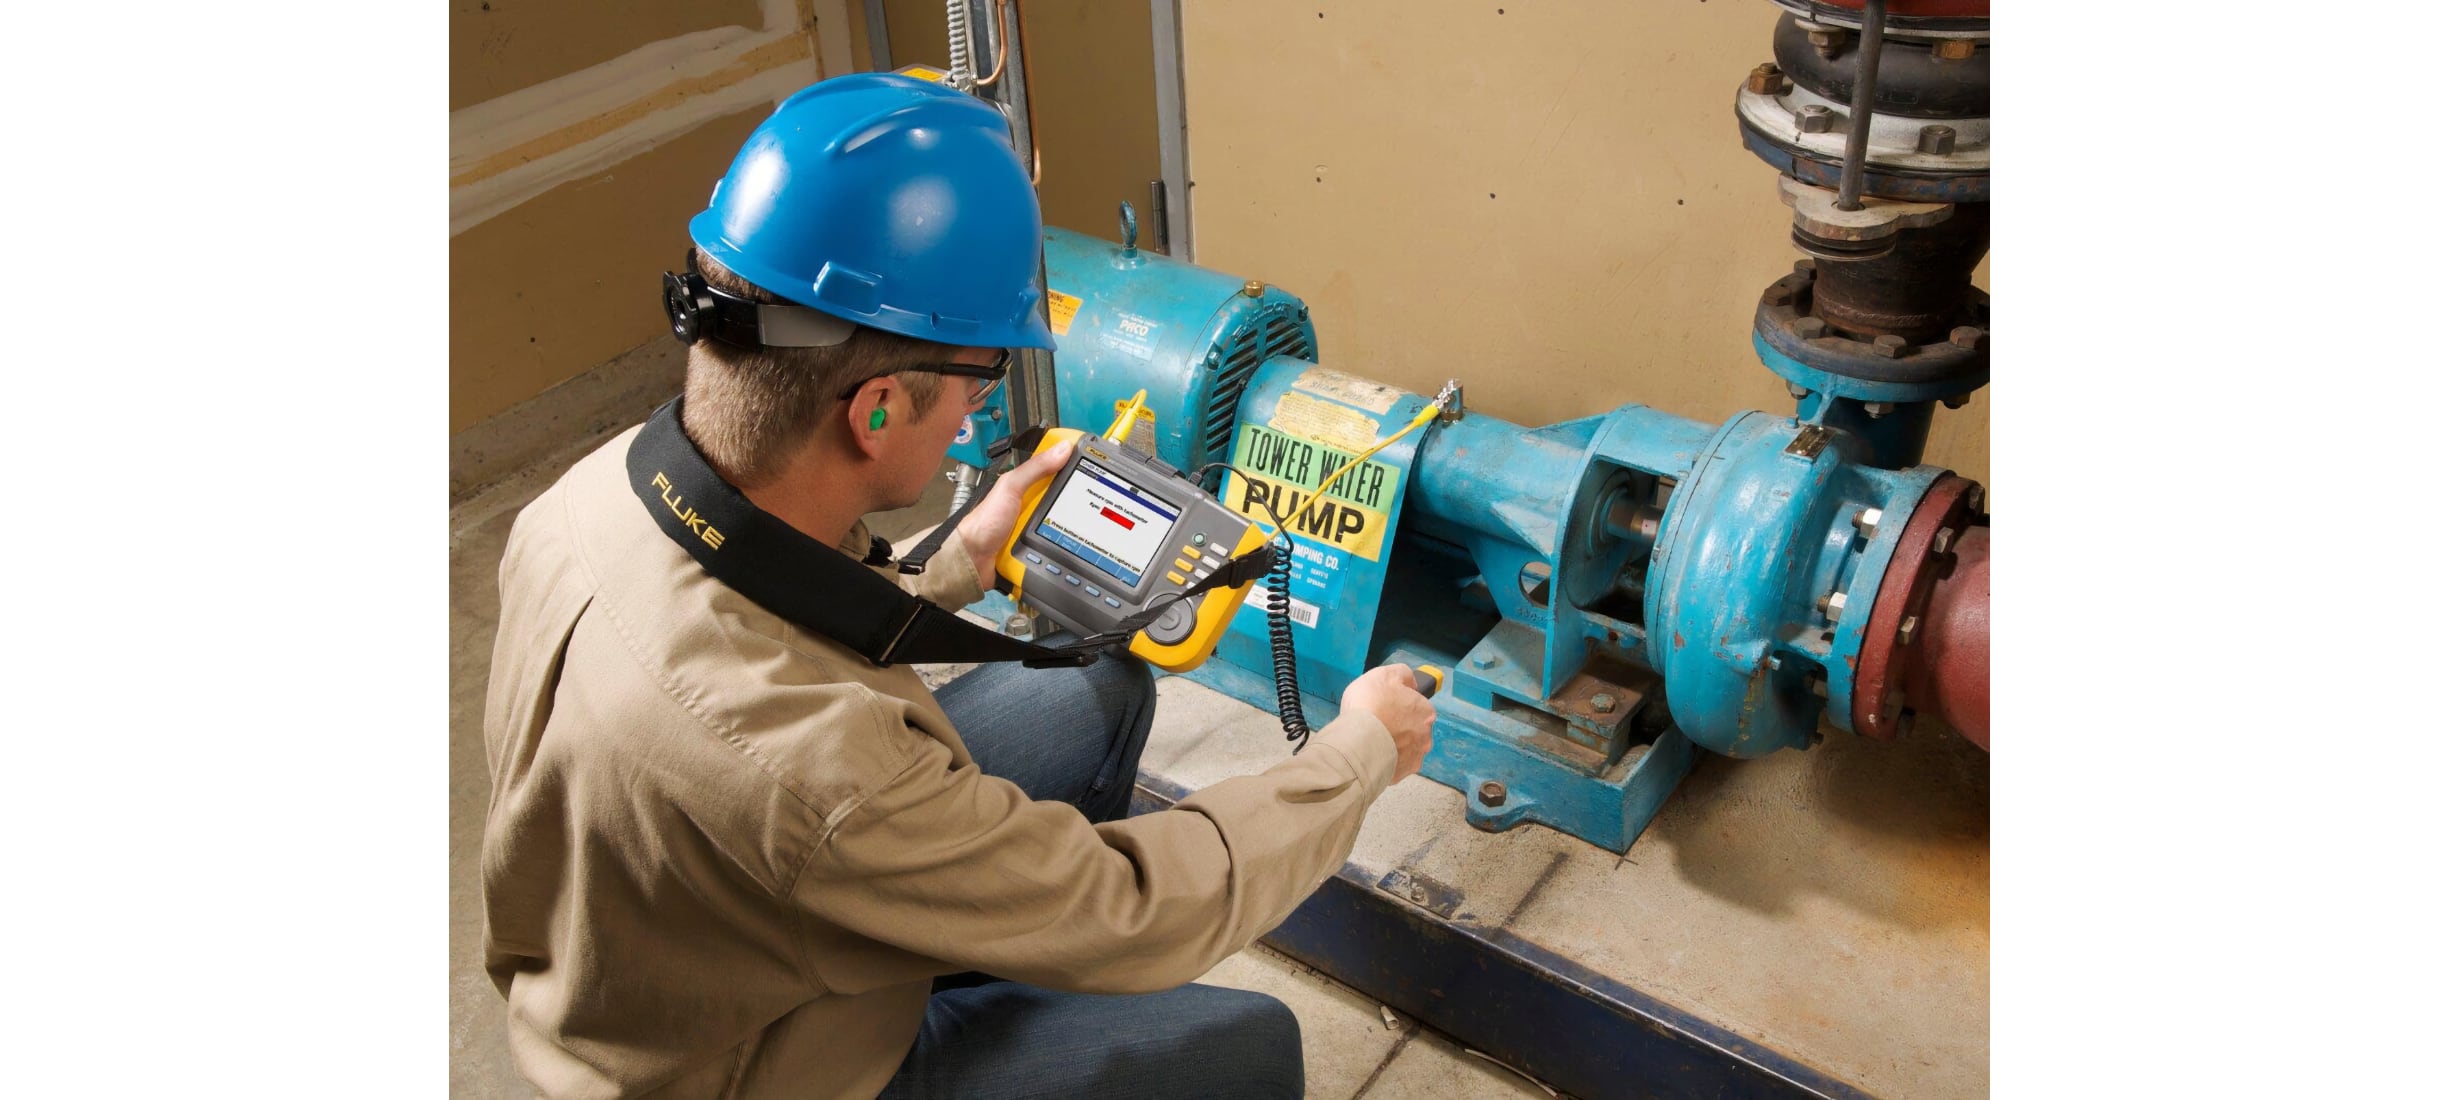
- Practical Integrated Functions: Included laser tachometer to precisely detect operating speed, self-test function to ensure ideal performance, 2 GB of expandable internal memory, and onboard contextual help to provide real-time advice to users.
Interpretation of the Severity Scale
The severity scale of Fluke 810 tester reflects the fault intensity at the time the measurement is captured; it does not indicate an estimate of the time remaining before a breakdown occurs. Indeed, fault progression depends on numerous variables such as machine type, age, and load. Generally, the four conditions can be evaluated as follows:
| Severity Level |
Recommended Actions |
| Slight |
No repair required. It is recommended to monitor the machine and re-test after planned maintenance interventions. |
| Moderate |
A future fault is likely (months, up to a year). It is recommended to increase the frequency of vibration tests and ensure spare parts are available. Plan the intervention. |
| Serious |
Intervention probably required before the next downtime period (weeks). The fault may already show physical signs such as noise and bearing overheating. If possible, limit equipment operation and re-test shortly to confirm the trend. |
| Extreme |
Repair intervention to be executed immediately (days) or consider shutting down the machine to prevent irreversible faults and extensive damage. Thermal, acoustic, or structural movement symptoms are generally already visible. |
Diagnostic Details and Spectral Analysis
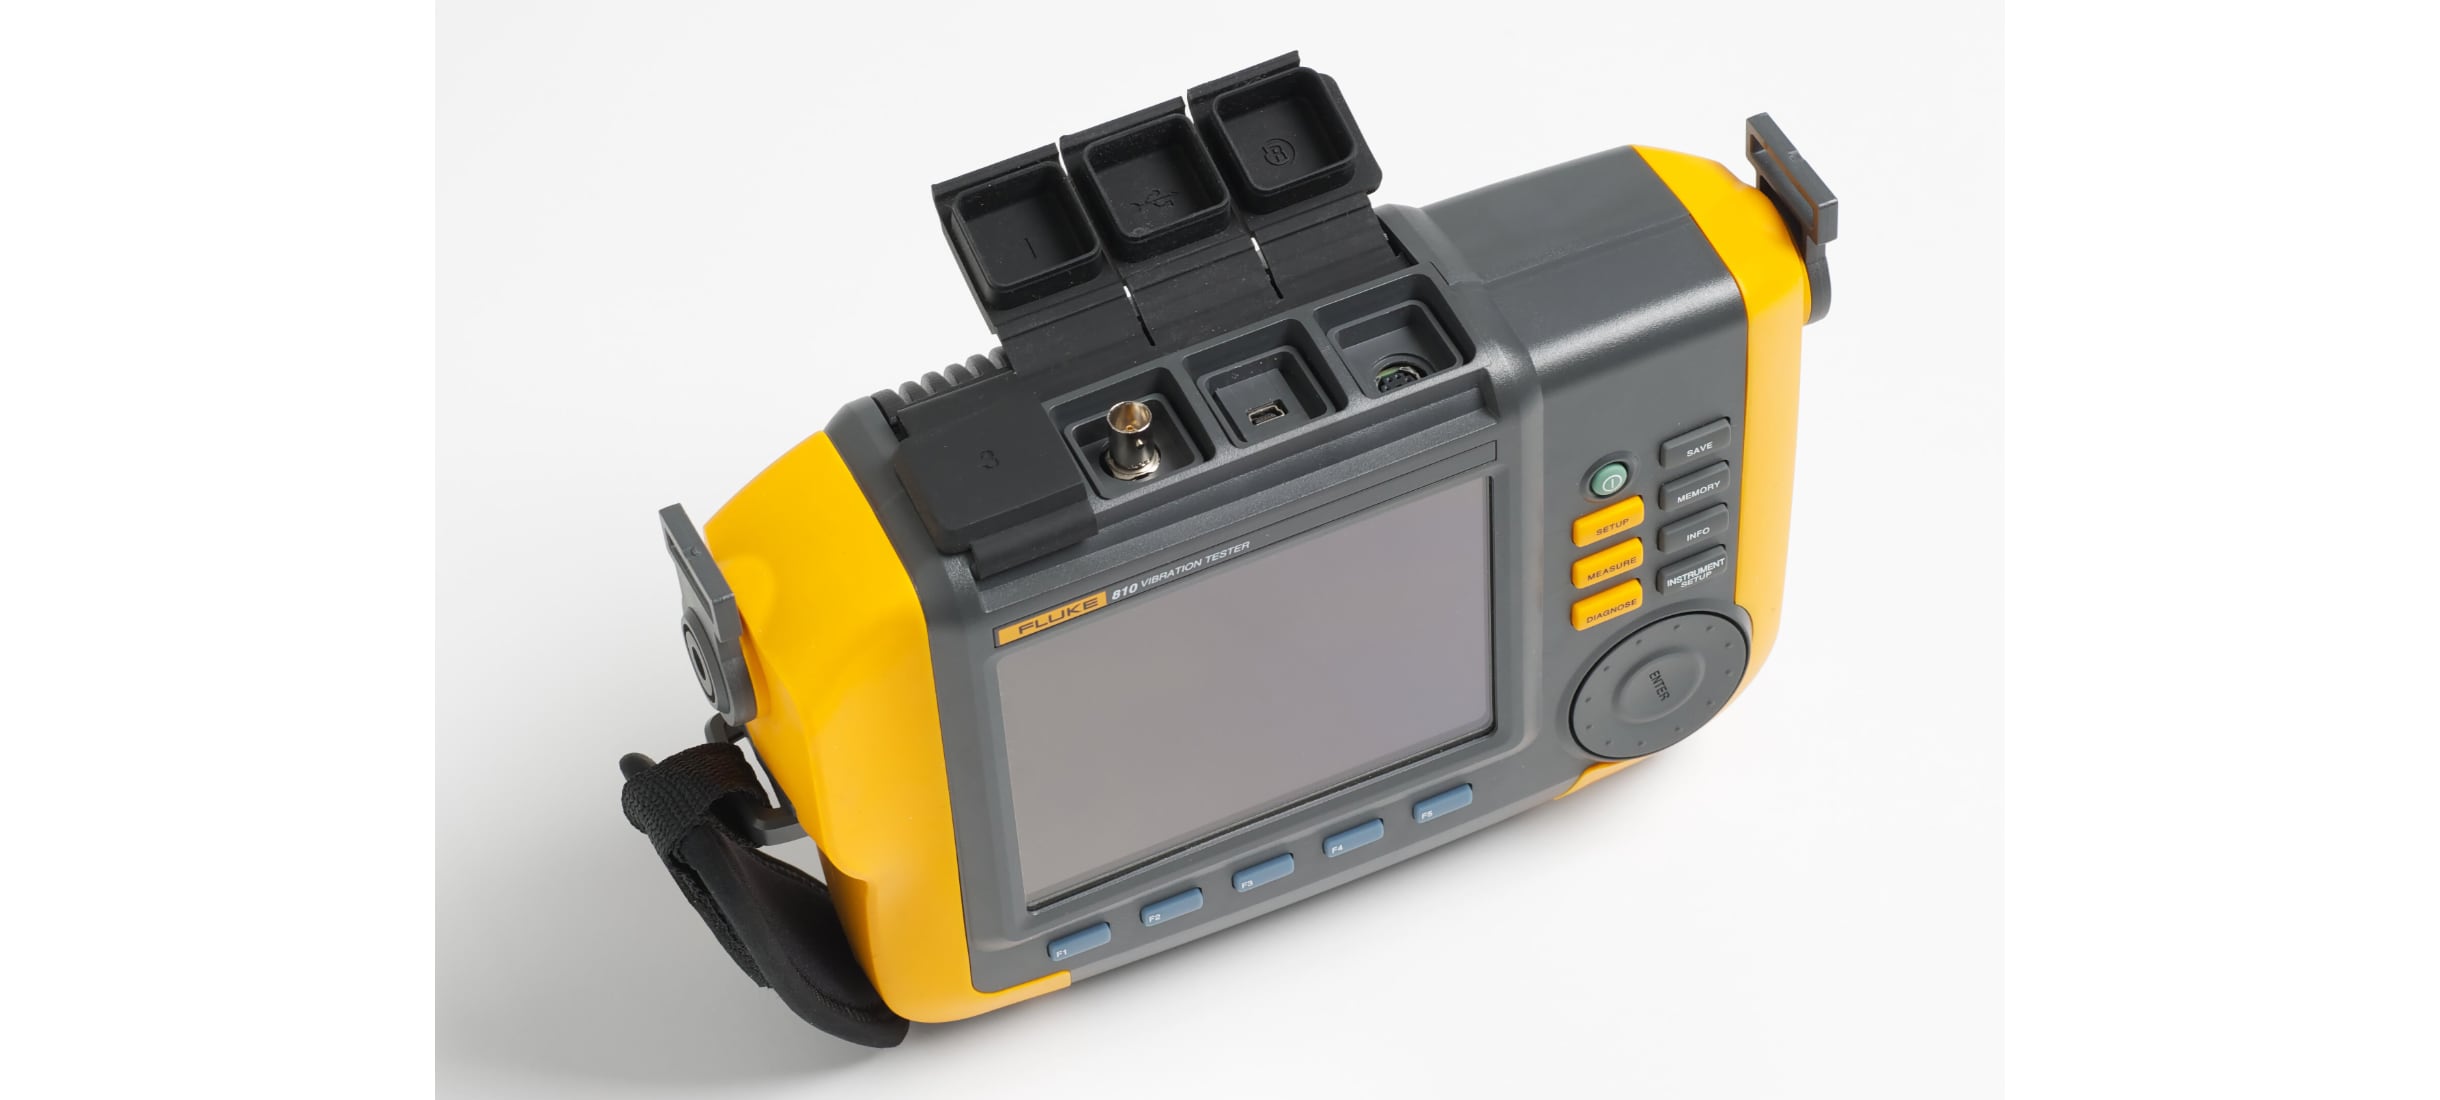
Fluke 810 captures oscillatory movement data and processes it from the time domain to the frequency domain, creating spectral plots (spectra) where vibration amplitude is plotted as a function of frequency (or RPM). Mechanical faults generate variations at specific frequencies: the tester's algorithms recognize these abnormal amplitude peaks, referred to as "called peaks," and use them to isolate the nature and severity of the defect. For deeper visualization and analysis, diagnostic data can be exported to a PC (via USB) and examined using the provided Viewer Software application, which allows for comparing spectra and creating detailed, structured reports.










Leave a Comment